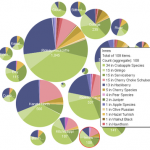
Below is a visualization of the same data that is on our tree
map — the source is the City of Ottawa’s street tree inventory as of
November 2011. The green dots (![]() ) on our
map show the City-owned trees which may produce edible fruits or nuts.
) on our
map show the City-owned trees which may produce edible fruits or nuts.
We say ‘may produce’ since some trees will not be producing food, for a few reasons:
- They have not reached maturity – for example, a Turkish Hazel may not produce a yield until its 4th or 5th year.
- They are a male tree which will never produce fruit, such as a male Ginkgo tree – only the females produce nuts in this species.
The City estimates that less than one third of all trees on city property have been inventoried. If the count of food-bearing trees in your ward seems low, then that may mean that 1) the food-bearing trees in your ward are on private or federal land or 2) they have yet to be inventoried by the City.
April 2013 UPDATE:
The City of Ottawa has inventoried an additional 100,000 trees which exist on properties that they own (parks, street rights of way, boulevards, etc…). We have updated the data in the chart below:
UPDATE 2015: the IBM ManyEyes site which hosted these free visualizations has moved to http://www-969.ibm.com/software/analytics/manyeyes/ and we are not sure if or when IBM will port our old visualizations over to this new manyeyes website.


